

Home Values Are Rising in 2025 – Why the Media Gets It Wrong
Home Values Are Rising Despite Media Claims -
In today’s real estate market, there’s a lot of noise from the media suggesting that home prices are falling. Headlines scream about declining average and median home prices, painting a picture of a cooling market. But as a 40-year veteran in the mortgage industry, I can tell you that’s not the whole story. The reality is that home values are increasing, driven by a chronic lack of inventory for the types of homes buyers want. What we’re seeing is a shift in what sells: more affordable, practical homes suited to modern families are selling faster, while big, luxury properties sit on the market longer due to fewer buyers in that segment. This mix is pulling down average and median prices, but the underlying value, especially when measured per square foot, is on the rise.
Let’s break this down with the latest data from June 2025, courtesy of the National Association of Realtors (NAR), and explore why this trend is happening.
The Current Snapshot: Sales Are Stable, But Inventory Tells the Tale.
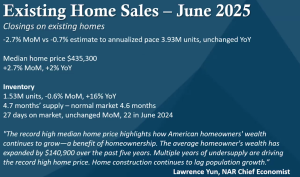
Existing home sales in June 2025 came in at an annualized pace of 3.93 million units, unchanged year-over-year but down 2.7% month-over-month. This is against an estimate of -0.7%, so it’s a bit softer than expected. But look closer: the median home price hit $435,300, up 2% from last year and 2.7% from May. That’s not a fall - that’s growth!
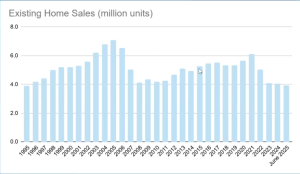
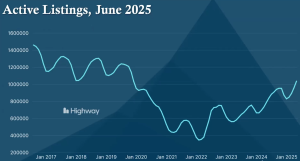
Over the long term, sales have fluctuated, peaking around 7 million units in 2005 and dipping below 4 million during the 2008 crisis. Today, we’re at levels similar to the early 2010s, but with one key difference: inventory is tight. Active listings in June 2025 stood at 1.53 million units, up 16% year-over-year but still down 0.6% from May. That’s 4.7 months’ supply - close to the normal 4.6 months, but far from the balanced 6 months we’d like to see for a healthy market.
This scarcity is pushing values up. Homes spent an average of 27 days on the market, unchanged month-over-month but up from 22 days in June 2024. Buyers are competing for what’s available, and as NAR Chief Economist Lawrence Yun notes, “The record high median home price highlights how American homeowners’ wealth continues to grow - a benefit of homeownership. The average homeowner’s wealth has expanded by $140,900 over the past five years. Multiple years of undersupply have driven record-high home prices. Home construction continues to lag population growth.”
Internals Reveal Buyer
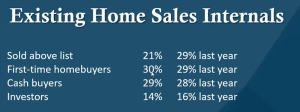
The breakdown of buyers and sales types further explains the “price drop” narrative:
- Sold above list: 21% (down from 29% last year)
- First-time homebuyers: 30% (up from 29%)
- Cash buyers: 29% (up from 28%)
- Investors: 14% (down from 16%)
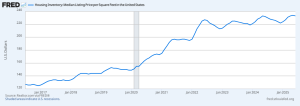
The Key Metric: Price Per Square Foot and Lot Size Trends. To see the true value story, we need to look at the price per square foot and lot sizes over the last 10 years. Home sizes and lots are getting smaller to meet modern family needs - think efficient, low-maintenance properties rather than sprawling estates. This makes homes more affordable on paper, but per square foot, values are climbing due to demand outstripping supply. For a visual, check out this chart from the Federal Reserve Economic Data (FRED) showing the median listing price per square foot from 2016 to June 2025. It’s been steadily rising, from around $140 in 2016 to over $200 in 2025, reflecting stronger underlying values even as overall prices fluctuate.
Lot sizes for new single-family homes have also trended smaller, from about 8,689 square feet in 2015 to around 8,312 square feet in 2023 (latest Census data), making homes more compact and cost-effective. This shift supports modern lifestyles but contributes to the perception of lower average prices. Combined with rising prices per square foot, it shows values are appreciating - there’s just not enough inventory of desirable, family-friendly homes to go around.
Why the Media Gets It Wrong - and What It Means for You
The media focuses on top-line numbers like median prices without context. Yes, if more $300,000 homes sell while $1 million mansions linger, the average drops. But that’s not a market crash; it’s a market adapting. Undersupply in mid-tier, family-oriented homes (think 3-4 bedrooms, efficient layouts) is the real driver, fueled by years of underbuilding post-2008 and rising construction costs.
For buyers: This is a great time to lock in if you can find the right fit. With rates potentially stabilizing, get pre-approved to compete in this inventory-constrained environment.For sellers: Price competitively, especially if your home fits the “modern family” mold - you’ll move faster.
About the Author:
Steve McNeal is the President and Loan Officer at First Capital Mortgage Inc., with over 40 years of experience in the mortgage and real estate industry (NMLS #256426, CA NMLS #2228346). Based in Modesto, California, Steve specializes in helping clients achieve their homeownership dreams through personalized loan solutions and innovative tools like co-branded social media marketing for real estate partners. He has held roles at companies like American Financial Network, Inc., New American Funding, and more, focusing on business growth, mortgage banking, and client education. Contact Steve at steve@firstcapitalmortgageinc.com or (209) 522-7100 to get started.
REFERANCES
——————————————————————————————————————-

Median Sales Price of Houses Sold for the United States (MSPUS) | FRED | St. Louis Fed
Graph and download economic data for Median Sales Price of Houses Sold for the United States (MSPUS) from Q1 1963 to Q2 2025 about sales, median, housing, and USA.
fred.stlouisfed.org
Average Sales Price of Houses Sold for the United States (ASPUS) | FRED | St. Louis Fed
Graph and download economic data for Average Sales Price of Houses Sold for the United States (ASPUS) from Q1 1963 to Q1 2025 about sales, housing, and USA.
fred.stlouisfed.org
US Existing Home Median Sales Price – Real-Time & Historica…
View live updates and historical trends for US Existing Home Median Sales Price. Track key economic indicators and market insights with interactive YChart…
ycharts.com
Historical US Home Prices: Monthly Median from 1953-2024
See United States historical monthly median single family home prices from 1953-2024. Non-seasonally adjusted values, with and without inflation.
dqydj.com
Median Home Price by State 2025
Discover population, economy, health, and more with the most comprehensive global statistics at your fingertips.
worldpopulationreview.com
United States Housing Market & Prices | Redfin
Wondering how competitive the U.S. housing market is? Find the median U.S. house price, housing demand, supply and real estate trends with Redfin.
redfin.com

Median Home Prices and Mortgage Payments by County
Median home values were calculated for 3,110 counties and county-equivalents. Explore the average home price in the USA.
nar.realtor
Average home price per square foot U.S. 2000-2022 | Statista
The average home price per square foot soared to a historical high in 2022, reflecting the high housing demand and the surge in building costs in the U.S.
statista.com
Average new home sales price in the U.S. 2023 | Statista
After a dramatic increase in 2022, the average sales price of a new home in the United States dropped slightly in 2023 from 540,000 to 511,100 U.S.
statista.com
Median Home Price By State: How Much Houses Cost | Bankrate
How much does a house cost? Read on to find out which states are the priciest places to buy a house, and which are the most affordable.
bankrate.com
Average House Price by State in 2025 | The Motley Fool
The average house price in the United States as of the fourth quarter of 2023 is $417,700. See how states compare here.
fool.com
United States Housing Market: 2025 Home Prices & Trends | Zillow
The average home value in United States is $369,147, up 0.5% over the past year. Learn more about the United States housing market and real estate trends.
zillow.com
United States Existing Home Sales Prices
Single Family Home Prices in the United States increased to 422800 USD in May from 414000 USD in April of 2025. This page provides – United States Existing Single Family Home Prices- actual values, historical data, forecast, chart, statistics, economic calendar and news.
tradingeconomics.com
Housing Prices in USA | Average house price | Median housing cost by state
This Database providing data about House price in USA, Average home cost by state, Housing price data by zip code and Housing price index by zip code.
statestatistics.org
US House Prices Growth | Economic Indicators | CEIC
Explore US’s growth of house prices. Compare and contrast house growth numbers with CEIC. Click here for more.
ceicdata.com
Average Sales Price of Houses Sold for the United States | FRED | St. Louis Fed
Graph and download economic data for Average Sales Price of Houses Sold for the United States from Jan 1963 to May 2025 about sales, housing, USA, HPI, price index, indexes, price, new, and median.
fred.stlouisfed.org
Home Price to Income Ratio – Updated Chart | Longtermtrends
Historically, an average house in the US cost around 5 times the yearly household income. The ratio in this chart divides the Case-Shiller Home Price Index by the US median annual household income.
longtermtrends.net
How US Home Values Have Changed Over the Last 20 Years
Home prices and mortgage rates are traditionally thought of as relatively stable and slow-growing, more or less keeping up with the rate of inflation while exhibiting little volatility. Older…
finance.yahoo.com
How Much an Average Home Has Cost in the United States Over Time
How Much an Average Home Has Cost in the United States Over Time
madisontrust.com
r/coolguides on Reddit: A cool guide to how U.S. home prices have changed through the years (adjusted for inflation)
4.5K votes, 329 comments. 5.9M subscribers in the coolguides community. Picture-based reference guides for anything and everything. If it seems like something someone might print, physically post, and reference, then it is a good link for this sub. Remember: Infographics are learning tools, guides are reference tools. Sometimes it’s grey.
reddit.com
Stop Losing Leads! - First Capital Mortgage
Hello, future partner! My name is Steve McNeal, and I have over 39 years of experience in the mortgage and real estate industry. I want to help you grow your business and capture more potential leads. First Capital Mortgage offers co-branded social media marketing tools for our partners that no other Mortgage Lender or Mortgage broker in the Central Valley, or Knoxville TN is currently offering. Don’t miss another potential client. Schedule a time below to learn more about how I can help you grow your business.
firstcapitalmortgageinc.com
Steve McNeal – 1st First Capital Mortgage
Meet Steve Steve McNeal President & Loan Officer | NMLS #256426 | Speaks English steve@firstcapitalmortgageinc.com (209) 522-7100 Apply Now CA NMLS #2228346 […]
firstcapitalmortgageinc.com
Steve McNeal – First Capital Mortgage | LinkedIn
Steve has helped me manage and increase my work potential tremendously. I recommend him for anyone that is looking to increase their business and productivity in the real estate/ lending industry! Thank you Steve for all your help! Looking forward to working with you more!" … If you've been saving and are finally ready to move out on your own, give us a call and let's get you preapproved for your dream home! Steve McNeal… · This normally isn't a LinkedIn type of post, but I thought it was important to share…  God is good! Life is great! Cancer's Serious! Life is… · Real estate agents - qualify more of your buyers with 100% gift fund programs! Give them the option of using gift funds for their entire down… · Good credit? Save even more on your USDA loan! Call today to learn more. Steve McNeal First Capital Mortgage INC.
linkedin.com
Steve McNeal email address & phone number | First Capital Mortgage Mortgage Broker contact information – RocketReach
Steve McNeal, based in Modesto, California, United States, is currently a Mortgage Broker at First Capital Mortgage Inc., bringing experience from previous roles at American Financial Network, Inc., New American Funding, Brain-Based Coaching for Performance, Love of Life, and Commercial Financing Center. Steve McNeal holds a 1984 – 2015 . With a robust skill set that includes Mortgage Banking, Residential Homes, Sales Management, New Business Development, Business Strategy and more, Steve McNeal contributes valuable insights to the industry. Steve McNeal has 4 emails and 1 mobile phone number on RocketReach. … Redirecting you to the search page. If you’re not automatically redirected, please click here · Find contact details for 700 million professionals. …
rocketreach.co
Facebook
facebook.com
Mortgage lenders on Zillow
Search for mortgage lenders on the largest online directory of licensed lenders. Read thousands of customer reviews to find a lender for your home loan.
zillow.com
Steve McNeal – Self-employed | LinkedIn
I love talking to people and understanding their needs. I’m a hard worker and always try… · Experience: Self-employed · Education: Hard Knocks · Location: Las Vegas · 500+ connections on LinkedIn. View Steve McNeal's profile on LinkedIn, a professional community of 1 billion members.
linkedin.com
Mortgage Broker in Knoxville, TN | First Capital Mortgage Inc.
Get low mortgage rates in seconds with a mortgage broker in Knoxville. Use our FREE online pre-approval tool or our refinance rate checker.
firstcapitalmortgageinc.com
First Capital Mortgage – Modesto, CA – Alignable
Highly Recommended: 24 local business owners recommend First Capital Mortgage. Visit this page to learn about the business and what locals in Modesto have to say.
alignable.com
First Capital Mortgage, Inc. in Modesto, CA 95356 – (209) 5…
First Capital Mortgage, Inc. located at 600 Wendy Court, Modesto, CA 95356 – reviews, ratings, hours, phone number, directions, and more.
chamberofcommerce.com
Housing Inventory: Median Listing Price per Square Feet in the United States (MEDLISPRIPERSQUFEEUS) | FRED | St. Louis Fed
Graph and download economic data for Housing Inventory: Median Listing Price per Square Feet in the United States (MEDLISPRIPERSQUFEEUS) from Jul 2016 to Jun 2025 about square feet, listing, median, price, and USA.
fred.stlouisfed.org
New Residential Sales Press Release
An official website of the United States government · Data Inquiries Economic Indicators Division Residential Construction Branch 301-763-5160 eid.rcb.customer.service@census.gov Media Inquiries Public Information Office 301-763-3030 pio@census.gov
census.gov
Census
census.gov
2025-2030 Five-Year Housing Market Predictions | U.S. News Housing Market Index | U.S. News
The next five years will likely usher in more sales activity, but expect flatter price increases.
realestate.usnews.com
Size of new single-family homes in the U.S. 1975-2023 | Statista
In 2023, the average size of a single-family home built for sale in the United States amounted to 2,514 square feet.
statista.com
CHARS – Highlights
An official website of the United States government · Measuring America’s People, Places, and Economy
census.gov
The Median Lot Size in Every U.S. State in 2022
Lot sizes in the U.S. are shrinking compared to a few decades ago. Here's a look at the median lot size in every U.S. state in 2022.
visualcapitalist.com
Median home size in the U.S. 2000-2022 | Statista
The median square footage of a U.S. house has increased since 2000, reflecting the average American homebuyers’ preference for larger properties.
statista.com
The Median Home Size in Every U.S. State in 2022
Over the last century, the median home size in the U.S. has skyrocketed. Here's a look at which states have the biggest and smallest homes.
visualcapitalist.com
US Homes Have Gotten Bigger Over the Years. A Lot Bigger
24/7 Wall St has a list that shows how the typical American home has changed from 1920 to 2014. And that mainly means the homes have gotten way bigger. The list tracks various…
newser.com
New Single-Family Home Size Continues to Grow | NAHB
As people continue to use their homes for more purposes during the pandemic, including work, more residential space is needed. Recent data confirm this impact on the market continues to occur.
nahb.org
U.S. single-family homes – statistics & facts | Statista
Find the most up-to-date statistics and facts on single family homes in the United States
statista.com
Lot Values Trend Higher in 2024
Despite shrinking lot sizes, values for single-family detached spec home lots continued to rise, with the national median outpacing U.S. inflation and reaching a new high in 2024. The U.S. median lot value for single-family detached for-sale homes started in 2024 stood at $60,000, according to NAHB's analysis of the Census Bureau's Survey of Construction
eyeonhousing.org
New One Family Houses Sold: United States (HSN1F) | FRED | St. Louis Fed
Graph and download economic data for New One Family Houses Sold: United States (HSN1F) from Jan 1963 to May 2025 about 1-unit structures, headline figure, family, new, sales, housing, and USA.
fred.stlouisfed.org
New Single-Family Home Size Decline Continues
An expected impact of the virus crisis was a need for more residential space, as people use homes for more purposes including work. Home size correspondingly increased in 2021 as interest rates reached historic lows. However, as interest rates increased in 2022 and 2023, and housing affordability worsened, the demand for home size has trended
eyeonhousing.org
Single-Family Home Size Increases
An expected impact of the virus crisis was a need for more residential space, as people used homes for more purposes including work. Home size correspondingly increased in 2021 as interest rates reached historic lows. However, as interest rates increased in 2022 and 2023, and housing affordability worsened, the demand for home size has trended
eyeonhousing.org
New Home Prices – Charts and Data
New Residential Sales data provides statistics on the sales of new privately-owned single-family residential structures in the United States.
mortgagenewsdaily.com
United States Nahb Housing Market Index
Nahb Housing Market Index in the United States increased to 33 points in July from 32 points in June of 2025. This page provides the latest reported value for – United States Nahb Housing Market Index – plus previous releases, historical high and low, short-term forecast and long-term prediction, economic calendar, survey consensus and news.
tradingeconomics.com
New and Existing Home Sales Reports | NAHB
Explore NAHB’s detailed reports on new and existing home sales. Gain insights into regional and nationwide market conditions, housing demand and median sales prices to stay informed about the housing industry.
nahb.org
NAHB/Wells Fargo Housing Market Index (HMI) | NAHB
Explore the latest NAHB/Wells Fargo Housing Market Index (HMI) readings, a key indicator of home builder confidence and the overall health of the housing market. Understand the factors influencing trends and the implications for builders, buyers and the economy.
nahb.org
Lot Values Trend Higher
Lot values for single-family detached spec homes continued to rise, with national values reaching a new high in 2023, according to NAHB's analysis of the Census Bureau's Survey of Construction (SOC) data. The U.S. median lot value for single family detached for-sale homes started in 2023 stood at $58,000, with half of the lots valued
eyeonhousing.org
Research and Statistics
The National Association of REALTORS® provides the latest real estate research and statistics that affect the industry. Get the stats and stay informed.
nar.realtor
Existing-Home Sales
The Existing-Home Sales data measures sales and prices of existing single-family homes for the nation overall, and gives breakdowns for the West, Midwest, South, and Northeast regions of the country. These figures include condos and co-ops, in addition to single-family homes.
nar.realtor